News - Market Insight - Market Insight 2024Market Insight: The more things change…Aussie car-buying habits seem to have found their groove, but how have trends changed?8 Jul 2024 By MATT BROGAN FOR some time now the Australian new-vehicle market has been squarely focused on SUVs and light commercial utes. So how did we get here?
Our buying trends have changed – diversified, even – considerably over the decades, moving from large family cars into smaller and more economical four-cylinder hatches, before again changing tack toward tarted-up small trucks and an ever-larger choice of SUVs ranging from front-drive hatchbacks on steroids to full-blown off-roaders.
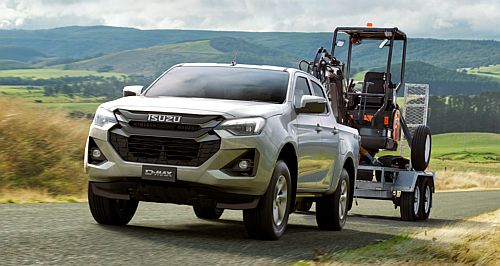
VFACTS figures released by the FCAI last week support the inclination of such preferences. Not only is the Ford Ranger Australia’s best-selling ‘car’ (with June sales of 6289 units), so too are light commercial models including the Toyota HiLux (5630) and Isuzu D-Max (2881).
Just one passenger car, the Toyota Corolla, was in the top 10 most-popular models with 2232 delivered last month to earn tenth place on the table.
The remainder of the month’s top 10 sellers were SUVs including the Toyota RAV4 (3907 units), Mitsubishi Outlander (3045), Tesla Model Y (2906), Mazda CX-5 (2687), Toyota LandCruiser (2457), and Ford Everest (2267).
VFACTS data shows an interesting and varied period of top-selling models over recent decades, preceded by stalwart Aussie favourites like the Holden Commodore and Ford Falcon – which essentially dominated the two-horse race that was the 2000s (and earlier).
From taking around 17 per cent of the annual new-vehicle sales tally 15 years ago, the light commercial vehicle market has grown to account for almost 23 per cent of all new vehicles registered today.
More discernible, however, is the swing away from four-door sedans, wagons and hatchbacks.
In 2009, Australian-made cars like the Holden Commodore, Ford Falcon, and Toyota Camry were still de rigueur, with passenger models accounting for some 57.6 per cent of all vehicles delivered that year.
By way of comparison, SUVs accounted for just 20 per cent of all vehicles sold that year.
Move to the present day and these numbers have essentially switched. At the end of the 2023-24 financial year passenger car sales tallied just 17.9 per cent of the overall market, while SUVs made up a majority 55.6 per cent share.
What is interesting about the popularity of SUVs is that it appears to be more than just a ‘trend’.
Scientific studies have found socio-psychological evaluations take place in the mind of SUV buyers, who deem the vehicles ‘safer’ and ‘more aspirational’ than their passenger car counterparts.
Some have gone so far as to suggest that buying an SUV is a response to the perception that the outside environment is a threat. In other words, an SUV purchase is a risk management response, or one that creates a sense of defended personal space.
There is also a suggestion that SUV ownership is a display of dominance, with studies finding a correlation between the drivers of such models and so-called risky or aggressive driving.
However, studies dating to before the COVID-19 pandemic suggest the popularity of utes and large SUVs increased the road toll by about five per cent, which could be even higher today given the increased uptake of such vehicles since.
Whatever the reflection on SUV buyers might be – socio-psychological or otherwise – it seems obvious to us that they are here to stay; and with many OEMs now producing ranges exclusively populated by high-riding models, the number of SUVs found in these charts looks only set to grow.
Australian new car buying trends (2009-24)*:
*All data supplied courtesy of the FCAI; measured annually as at June 30.
 |
Click to shareMarket Insight articlesResearch Market Insight Motor industry news |


Facebook Twitter Instagram